

Let's look at how to create a new template, using of the Data Containers provided with Sage Intelligence Reporting.
With the Standard version of SI, you may use any of the Data Containers used in the provided reports to create a new report template.
In the following, we'll create a report that displays the sales by a sales person in a given time frame as an example.
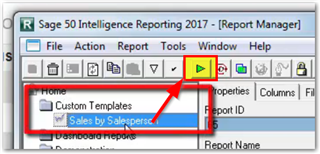
STEP 1: Use the Report Manager to start creating the customized report.
Click the Reports menu > Sage 50 Intelligence Reporting > Report Manager.
STEP 2: Select location to store template.
See our previous blog here for instructions on how to add a folder named "Custom Templates" to the Home section of the Report Manager.
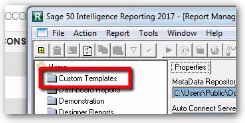
We'll use it to store our new template. Select it, then click the + (plus) symbol to start creating a report.
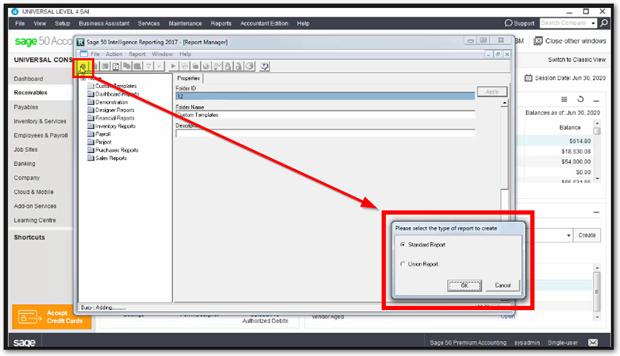
STEP 3: Select the type of report to create.
- The Standard Report option will create a new report.
- A Union Report is made up of two or more standard reports.
Select Standard Report and click OK. Enter a name for the new report, in our case we'll name it "Sales by Sales Person" and click OK.
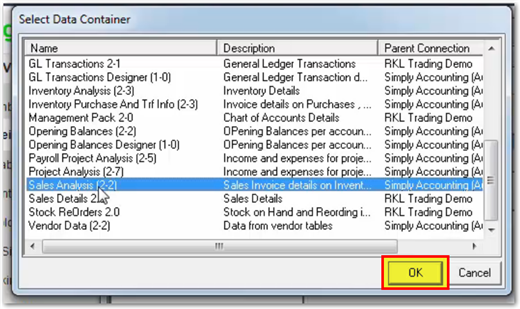
STEP 4: Working in the Select Data Container window
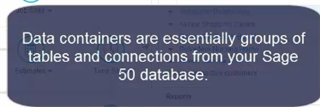
The Select Data Container window will appear allowing the selection of the Data Container we will use in this report. Below we selected "Sales Analysis (2-2)", clicked OK.
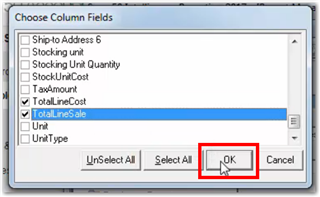
STEP 5: Choose your report's Column Fields
Next, select the columns fields that you require in your report. The columns available, are based on the Data Container that you previously selected.
On the Choose Column Fields screen we selected the SalesmanName, the total cost of sales (TotalLineCost), and the TotalLineSale boxes. Finish by Clicking OK.
STEP 6: Run the report.
Your new report is now available to be generated and customized. It can be run from your Custom Templates folder. See our previous blog here for more details on what this process looks like.
- Reminder: You'll need to have MS Excel installed to be able to run this process.
Data selected is saved on Sheet1 of the workbook that opens. Sheet2 contains basic information on the report parameters. Do not remove / delete these sheets.
Sheet3 is used to create the report. Visit the Insert tab on the ribbon to select PivorTable which will use data on the 3 columns imported on the report. Sage Intelligence Reporting will automatically name the range of imported RawData. Click OK.
STEP 7: Adding fields to the report.
You can now add fields to the report table to display data on sales by sales persons. Next format the table to make it easier to read. Once ready, return to the report manager screen and link the template to the newly created report under your Custom Templates folder. You'll see a screen to select the workbook, after this click OK.
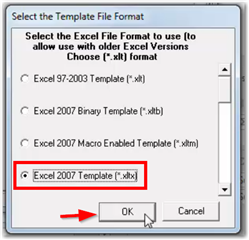
You may have noticed in the above animation that at the end we selected a Template File Format. This was the .xltx format, which ensures that the file is compatible with older versions of MS Excel. This is optional, please select the format that best suits your needs.
Confirm the name and click OK. Click No to save the PivotTable layout. You'll then receive confirmation that the "template was created successfully and linked to the report."
STEP 8: Select your report's parameters
For each report, you can define additional options. This is done from within the Report Manager window. Options include:

The dates included in a report can be defined as a Parameter. Click the Parameters tab, then click on Add to choose a Parameter, we selected Date. Click OK, then select "Greater Than Or Equal To". This allows us to select the start date for the report. Pressing the … button on the next window will allow you to select a date which will be the default every time the report is run.
Click the @ sign to select a system variable. In our case, we chose this and then chose the start of the current period of 1 June 2020. Click Ok twice to confirm.
Repeat the above to add an end date to the report. When on the Choose Filter Fields parameter screen, select Date once again, then Ok, followed by the selection of "Less Than Or Equal To."
Finally, select a System Variable again, but select the end of the current period. We selected 30 June 2020. Click OK twice.
Learn more
If you'd like to learn more about the below topics, then please sign up for our anytime SageU learning course called 50CAA - Sage 50—Canadian Edition - Level 4: Application Specialist (Anytime Learning)
You can also inquire more about the cost of the Standard or Connector version of Intelligence Reporting by contacting our Sage 50 CA sales team at 1-888-261-9610.
Thanks for reading!


For more resources visit: Sage Product Support Resources for help with products in North America