
 Excel shows only visible data in a chart. In this tip, we will show you how to easily overcome this problem, by following these simple steps:
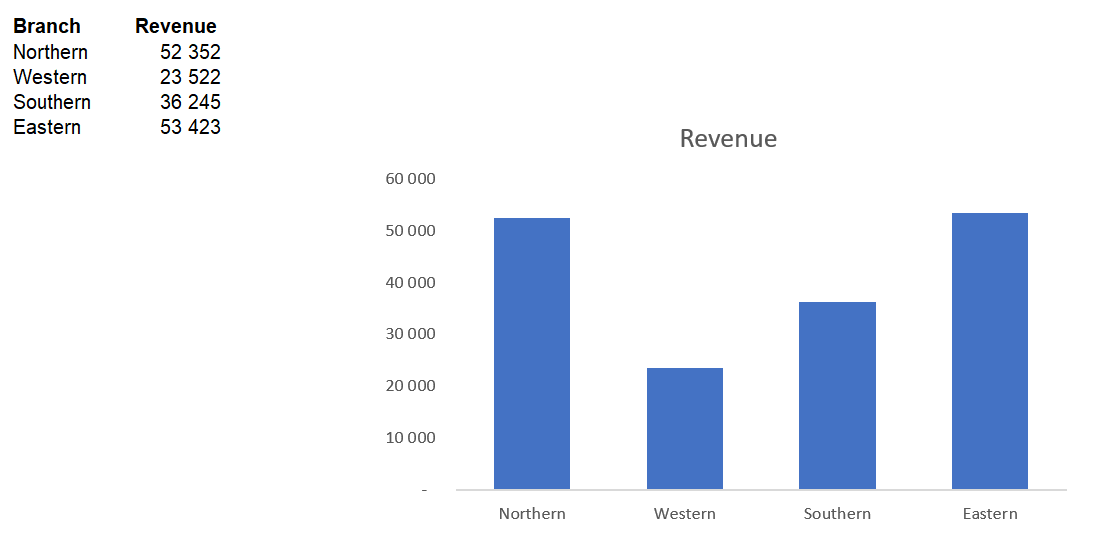
1. First, lets create a simple chart with your data to demonstrate.
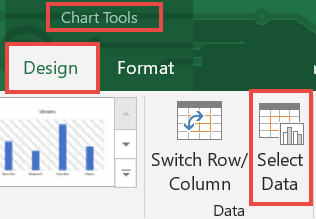
2. If you had to hide columns A and B, your chart will disappear. To prevent this from happening, click anywhere on the chart and from the ribbon, select Chart Tools > Design > Select Data
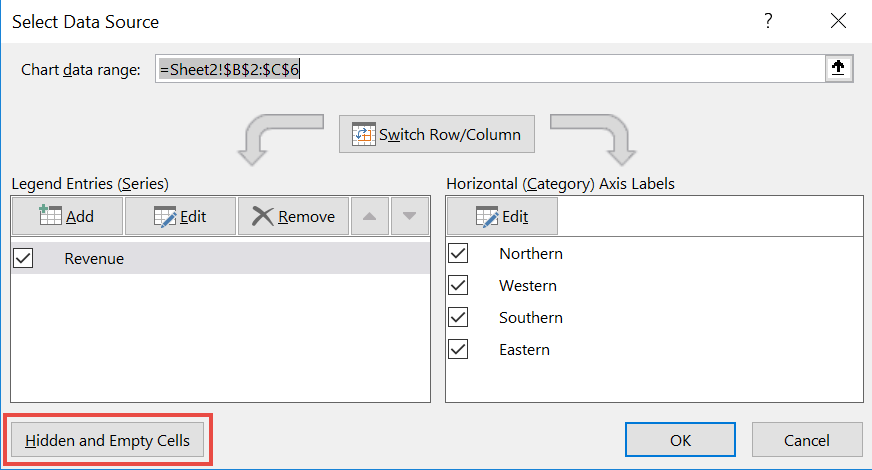
3. In the "Select Data Source" dialogue box, select "Hidden and Empty Cells" in the bottom left hand corner.
4. In the "Hidden and Empty Cell Settings" dialog box, check the box "Show data in hidden rows and columns".
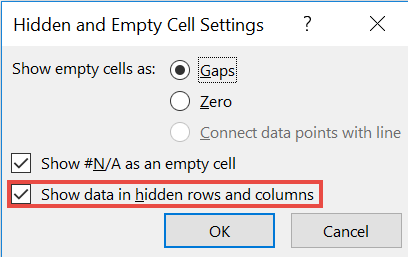
5. Select "OK" twice.
Now, go ahead and hide your data. Your chart should still display with the hidden data!