Sage Timeslips 2019 - Server Utilization shows 100% all the time

Hello Team,

I am working on one TimeSlips server performance issue as below.

We have one Sage Timeslips server at our customer premises and on that server, we are running Sage Timeslips 2019 application.

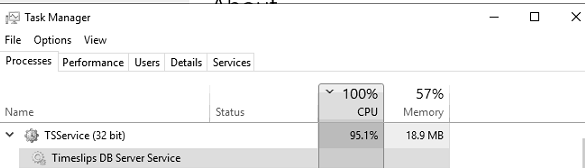
From last few days we seen the server CPU utilization always shows 100% and after troubleshooting we found that Timeslips DB service is utilizing 95% of CPU.

We tried many possible solutions like, uninstalling AV, updating OS patches, but still there is no change is CPU usage.

It would be great if someone could help me with my issue.

Server config:


Task Manager:

  • 0 in reply to Umesh Shetkar

    Hmm, thanks Umesh. I did some testing on my own machine today re: TSService, pulling up my resource monitor, launching v2019 and making a backup. My TSService never moved from 10 Threads and 0 CPU. So more broadly, I am trying to figure out what would make some sites have this ballooning CPU, but not others. Because this is not an FAQ. Not that it never comes up, but it's just not a common complaint.

    I'm afraid I don't have any other theories at this point as to why your two locations have such high CPU usage.

  • 0 in reply to Nancy Duhon

    Thanks, Nancy, please keep me updated on this, this is going to be a serious issue with us for both the client and we don't have an action plan because we don't understand application design development-wise.

    Now if I tell you, morning around 10 AM EST I restarted the service and after that till now server was working fine, now again I checked in the task manager and found CUP usage are again increasing by the Timeslips DB service

    I feel, if your development / application design team can involve in this then we can debug the DB logs and try to find out root cause,

  • 0 in reply to Umesh Shetkar

    , I don't disagree with you. But please understand the following nuance: neither myself or @Caren2 are employees of Sage. We are just independent Certified Consultants for Timeslips. So unfortunately, we have no "sway" at Sage as to being able to get any Sage dev resources devoted to this issue. We can only try and help you with what we know, or can find/figure out.

    While yes, it is always cleaner to figure out the source and stop it from happening in the first place, we may be left with only being able to treat the symptoms created by the problem.

    Are you at all able to see when it goes from 0 to 100%, and what sorts of activities are happening around that time with your resource monitoring?

    I'll keep looking, and let you know if I find anything else.

  • 0 in reply to Nancy Duhon

    Thank you a lot, Nancy! will be waiting for your next update.

    We monitored the resource monitor and didn't find any unexpected activities happening around that time.


  • 0 in reply to Umesh Shetkar

    I think your only other option is to turn it off as per this Knowledgebase article. Hate to do it, but in the end, if it is costing too much for the potential benefit, then it has to go. 

    bit.ly/DTS-WhatisTSService