
In this blog I will give an overview of a built-in tool that comes with Microsoft SQL Server that can be used to monitor SQL Server activity. The tool is named Activity Monitor. Activity Monitor displays information about SQL Server processes and how these processes affect the resources of the current server instance of SQL Server. I will give you a tour of the options available to help you get started.
I did some research and it appears that the Activity Monitor tool first came out along with SQL Server 2008. It doesn't appear the look of the tool has changed much between 2008 and today.
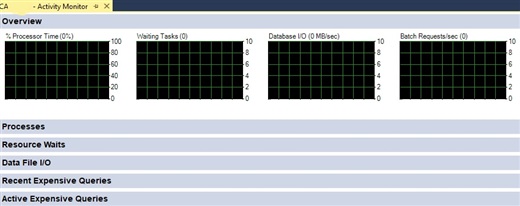
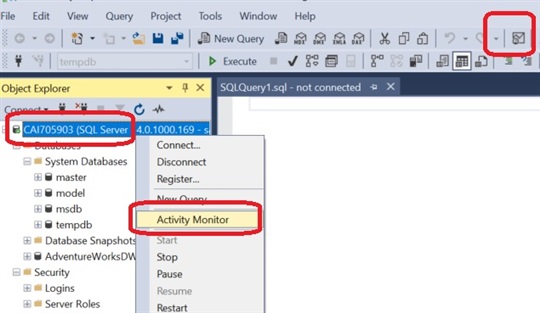
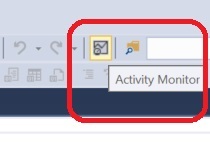
Activity Monitor is a real time monitoring tool that captures activity for Processes, Waits, File I/O, and Expensive Queries. To launch it, log into SQL Server Management Studio. Then, you can either right click the SQL Server you are connected to or locate the Activity Monitor icon
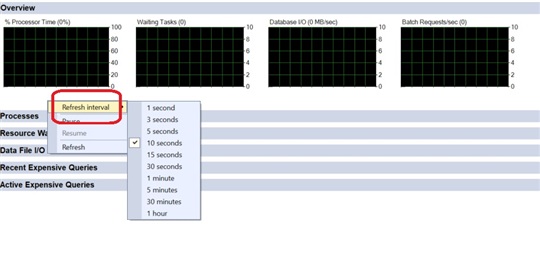
The data is captured in real-time at an interval of xx seconds. To change the interval, right click anywhere in the Overview section and select Refresh interval and select the desired interval time.
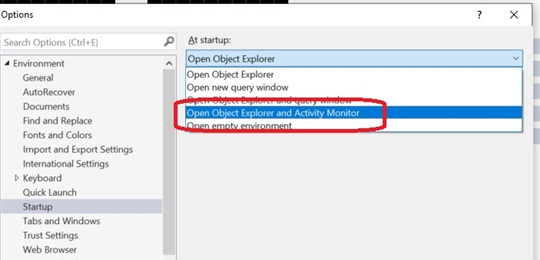
By the way, if you want to automatically launch Activity Monitor every time you log into SQL Server Management Studio, you can adjust the Startup option. From SQL Server Management Studio, Tools, Options... , select Startup and from the dropdown on the right side, select Open Object Explorer and Activity Monitor:
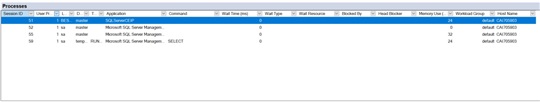
The Processes panel shows a list of all the processes running on SQL Server. You can see all the columns showing the Application name, Command running, Hostname, Database, etc.. Remember that the data will be refreshed every xx seconds based on your Interval setting.
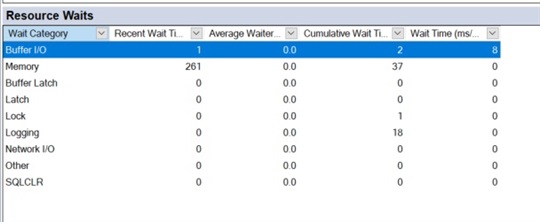
The Resource Waits panel shows a list of resources that are waiting based on Category. Use the innermost dropdown arrow next to the column name to sort the results from ascending to descending. Use the outermost dropdown arrow to filter the results based on the values in that category.
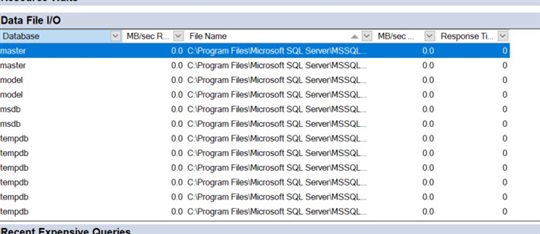
Data File I/O panel shows data related to file activity. The data is listed by Database and shows the file name and location, including the mdf and ldf. If there are multiple files for a given database such as multiple ndf files for tempdb for example, they will also be shown. You can also click on a column header and drag it around to place it next to a different column header.
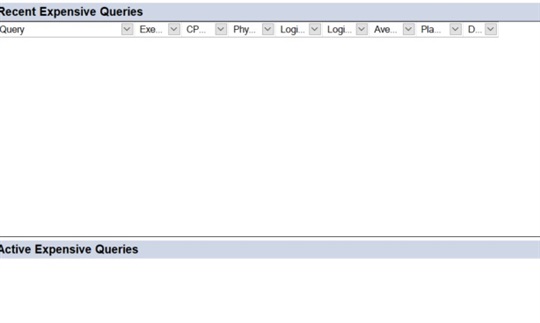
The last couple of panels, show information about expensive queries. The Recent and Active Expensive Queries panels show the expensive query in the Query column. If you only want to look at the X3 database, you can use the outermost dropdown to filter based on the X3 database. If you have a lot of databases on the SQL Server, you should look at all the databases for problem queries since they affect resources on the same sever instances. You can also right mouse click inside the results of these panels and view/edit the query or view the execution plan.
There are other ways to obtain similar information, but Activity Monitor is very easy to use and free. I intentionally did not deep dive into this tool, but I will in a near future blog. Please leave a comment if you have used Activity Monitor and what your thoughts are about it.
