You won’t believe this but it’s 100% true, in my experience people tend to favor reactive troubleshooting as opposed to proactive monitoring in the work place. Think about it, people are often overworked, usually wearing many hats and filling roles they didn’t intend to (a lot has been written about the Accidental DBA!). Plus, from a what’s in it for you point of view, it’s always nice to be the hero in a critical situation, usually something that is reported to an executive in the form of, “We can’t loose Billy Joe Bob, he’s our crunch time hitter, he solves the big problems.” And I have to admit myself, I’m always impressed when someone knows some new Matrix (yes, the first two movies were good, but third got weird!) kind of code that I never knew. It’s absolutely much less flashy to be so honed at your skill that you avoid these nasty problems completely in the first place, or catch them before anyone ever notices. Nobody ever says your name at the water cooler down at work, you aren’t in the company newsletter and your boss’s boss may not even know who you are. But, the company can benefit tremendously from this type of employee and that’s the aim of this article today, catching a problem before it becomes a big deal by setting Database Alerts inside SQL Server, just one of the ways you can be proactive with your Sage ERP X3 system. This article will eventually lead into another article about Sage ERP X3 Requesters so stay tuned.
What Alerts Should I set?
There are so many good alerts to set inside SQL Server Management Studio (SSMS), let’s talk about the staple alerts.
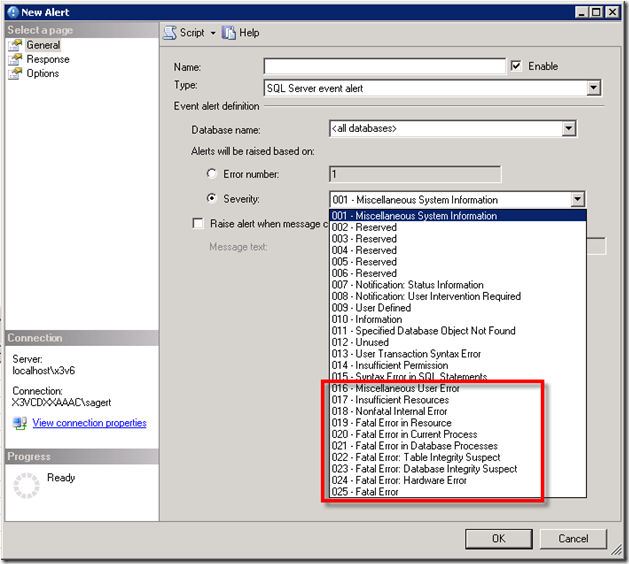
- Any alert with a severity of 16-25
- 16: Miscellaneous User Error
- 17: Insufficient Resource
- 18: Nonfatal Internal Error
- 19: Fatal Error in Resource
- 20: Fatal Error in Current Process
- 21: Fatal Error in Database Process
- 22: Fatal Error: Table Integrity Suspect
- 23: Fatal Error: Database Integrity Suspect
- 24: Fatal Error: Hardware Error
- 25: Fatal Error
- Error numbers
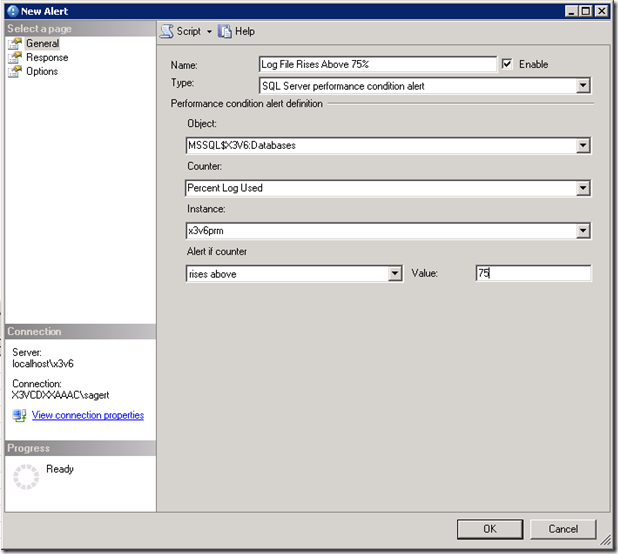
- <Insert Database Here> Log File Rises Above N%
- I usually set my value to 75% but you can set it to whatever makes sense for you given the size of your database. If you have terabytes of data then a lower percentage might make more sense for you.
- tempdb Data File Rises Above N KB
- You need to decide what size is too big for your system. Creating baselines here is mucho importante!
- tempdb Log File Rises Above N%
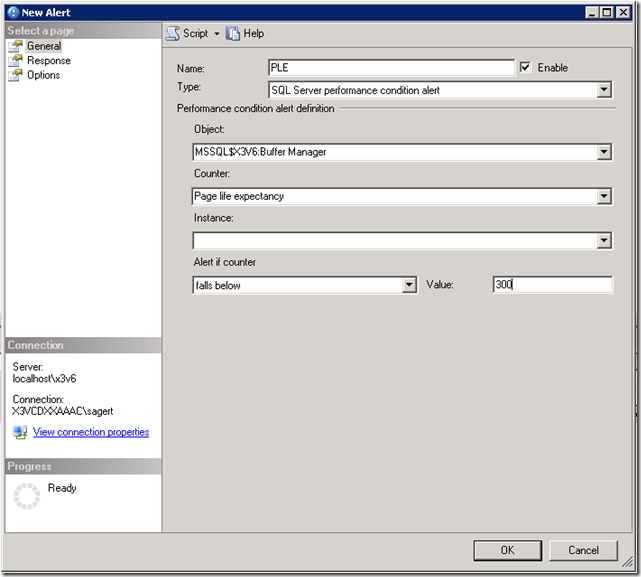
- Page Life Expectancy Falls Below 300 Seconds
- This is a measure of how fast data is moving through your cache pools. Microsoft used to recommend 300 seconds for this, but as the tech world advances a more refined formula for determining your PLE has come about. You can read more about it here.
There are so many more cool alerts to set, I think we’ll stop there for the moment. Feel free to add more alert in the suggestions down below, I’m sure the rest of the community will benefit too.
How Do I Set Them?
In order to receive an email when the alert fires you need to do a couple things.
Set up Database Mail
You need to first set up Database Mail so that SQL Server Agent can utilize the mail profile. Here are the steps on how to do this portion of the process. Be sure to test database mail to ensure you are able to receive emails at the desired email address.
SQL Server Agent Settings
After you’ve configured SQL Server’s database mail you need to tell the SQL Server Agent to utilize the database mail profile for sending alert emails. To do that, follow these steps. If you enjoy screenshots instead of TechNet text try out David Bird’s article instead.
Creating Your First Alert
I’ll show you all the different alert settings on the general page first, then I’ll show you how to set the Response and Options pages second. Here are the settings for the alerts identified above.
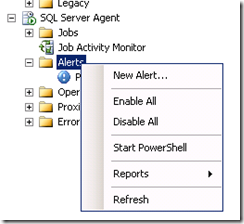
Inside SSMS open the SQL Server Agent node, then right click on Alerts and choose New Alert
General Tab
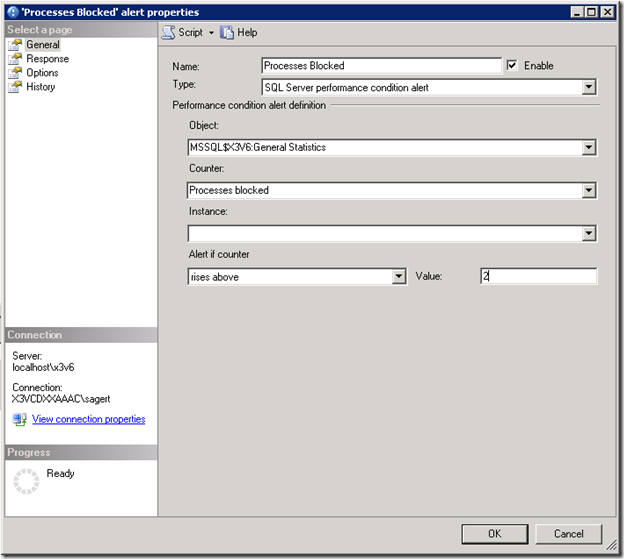
For the Processes Blocked alert set the general page like the following
Word to the wise, short lived blocks happen all the time on production databases. You may want to set your alert value to something above 0, such as 2.
For the Log File Rises Above 75% set your general page like the following
For the tempdb alerts set above you can change the database to in the drop down above to be tempdb instead
a) At this point you have the option of setting the counter to Data File Size or Percent Log Used (or more)
The SQL Server severity alerts previous described can be found here
If you are setting specific error numbers simply choose the “Error number” radio box instead of the severity radio box and type in the number.
Page Life Expectancy < 300 seconds
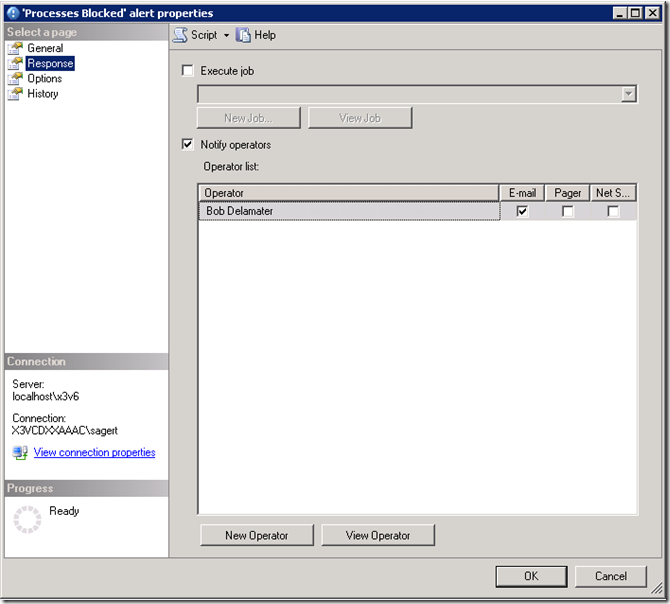
Response Tab
Once you’ve set the General page then be sure to set the Response page to notify an operator (create one using the New Operator button if you don’t already have one).
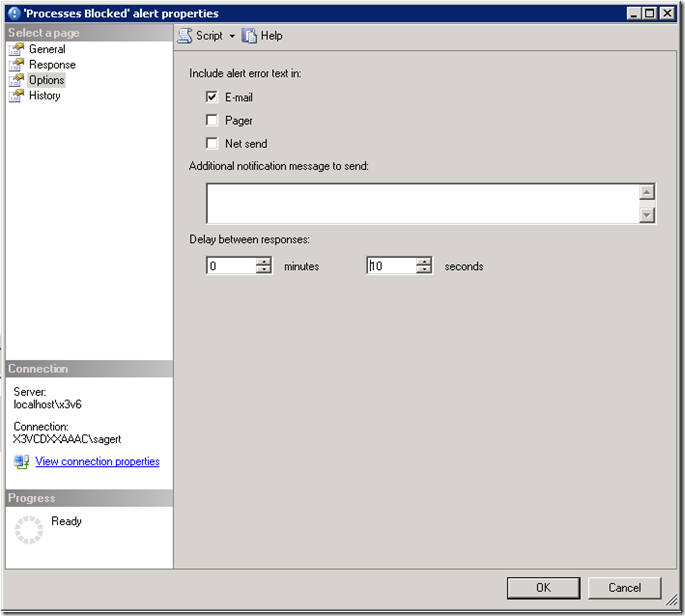
Options Tab
I like to set the options page to include alert error text in the email and also to delay responses by a certain number of seconds, such as 10.
And there you have it, some basic alerts to help you become a bit more proactive in your Sage ERP X3 diagnostics. I hope this helps you in some way, enjoy!


